

Chart, 8 In, -20 to +20 F/C, 7 Day, PK60 MPN:C448
Chart, 8 In, -20 to +20 F/C, 7 Day, PK60

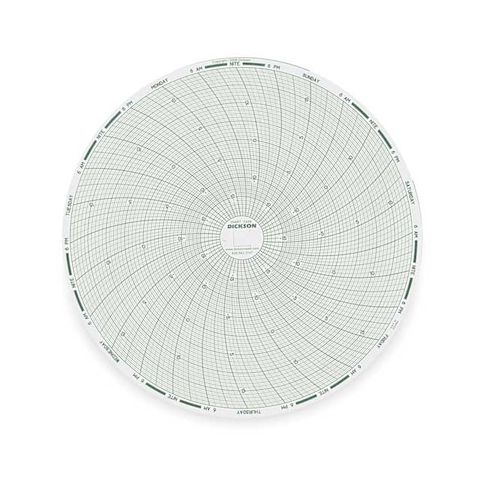
This 8-inch chart from Dickson is a reliable tool for monitoring temperature fluctuations between -20 to +20 F/C over a 7-day period. Ideal for use in industrial settings, laboratories, and research facilities, it provides a clear visual representation of temperature changes. The chart's compact design makes it easy to install and maintain, while its high-quality paper ensures accurate and long-lasting results. Suitable for a range of applications, including environmental monitoring, quality control, and process optimization, this chart helps users identify trends, detect anomalies, and make informed decisions. Its compact size also makes it easy to integrate into existing systems.
Top product features:
- This product chart measures temperature in both Fahrenheit and Celsius scales.
- The chart displays a 7-day record of temperature readings.
- The chart is circular in design and displays a strip chart of temperature data.
Top product applications:
- Temperature monitoring in industrial settings
- Recording temperature fluctuations in laboratories
- Monitoring temperature in data centers
Circular Paper Chart, Compatible with Manufacturer Model Number KT8-20, KT8-21, KT8-30, KT8-31R, KT8-40, KT8-50, KT856, KT8P0, KT8P2, KT8P3, Lowest Generic Number Recorded Not Applicable, Minimum DC Current Measurement Not Applicable, Product Type Circular Paper Chart, Strip Chart Length Not Applicable, Strip Chart Width Not Applicable, Highest Generic Number Recorded Not Applicable, Maximum AC Current Measurement Not Applicable, Maximum AC Voltage Measured Not Applicable
Additional Information
- Country of Origin: CN
- Drop Ship Item: No
- Blind Ship Eligible: No
- LTL Freight Required: No
- Lead Time: Ships in 1 days
- Minimum Order Quantity: 1
- Unit of Measure: PK
- Package Length: 8.50
- Package Width: 8.50
- Package Height: 0.50
- Package Weight: 0.55
Product info last updated on February 4, 2026 2:40pm UTC
Category: Data Collection Products